DeepSEA-SHARCQ
DeepSEA-SHARCQ
Deep (learning) for Simplified, End-to-end Automation — developing on Slice Histology Alignment Registration and Cell Quantification
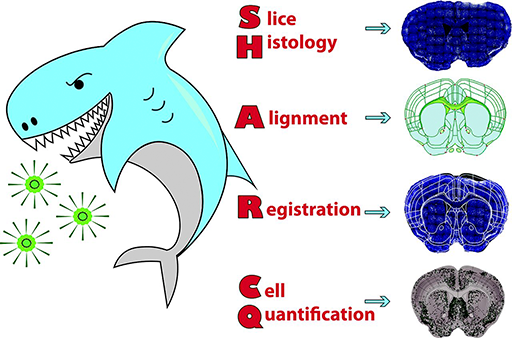 SHARCQ overview diagram
Overview
Advancements in genetically distinct cell-labeling have begun to outpace the analysis required to quantify it. Particularly for whole-brain mapping, robust and automated methods for quick post-imaging analysis have become increasingly necessary to process large amounts of data contained in images. To address the need for processing high-throughput imaging data, we developed a tool to count fluorescent cells by brain region using the digitized Allen Brain Atlas and the modified Franklin–Paxinos Atlas. This tool is called SHARCQ (Slice Histology Alignment, Registration, and Cell Quantification).
SHARCQ is developed by my friend and colleague Kristoffer Lauridsen. As stated, the field of Neuroscience is moving at an extremely fast rate and methods for analytics are not there to help quantify mass amounts of data. The original SHARCQ tool was built to align images and count cells by hand. As the volume of data grows this is found to be infeasible unless supported by a large team. That is where the project DeepSEA-SHARCQ came about. The goal is to automate as much of the processes that was being done by hand using machine learning and efficient data designs. I advanced the original SHARCQ process and developed new strategies to fully automate the brain image analysis.
Technology Used
Deep Slice
Neural Best Buddies (NBB)
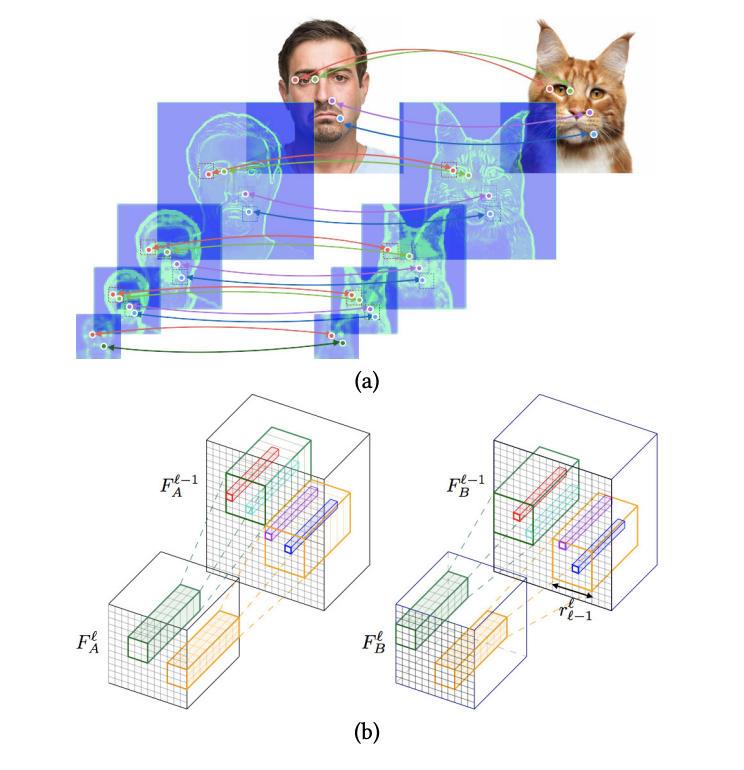 Neural Best Buddies correspondence visualization
One of the major challenges faced was aligning brain images with a standard model (Atlas Space). The method developed in SHARCQ was to go image by image and select landmark points that will morph the mouse brain to the standard model. I identified and incorporated Neural Best Buddies (NBB) — a method that uses vision models (VGG19) to identify key landmarks between images in a corresponding domain.
Transforming Mouse to Atlas
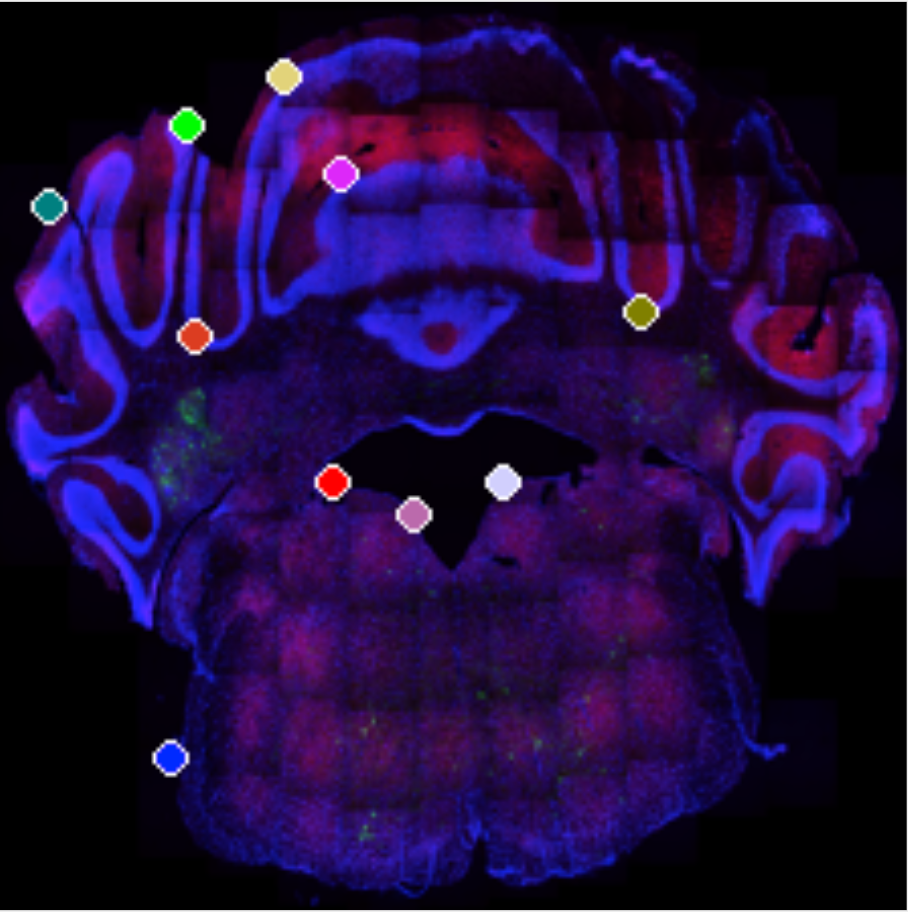 Mouse brain slice
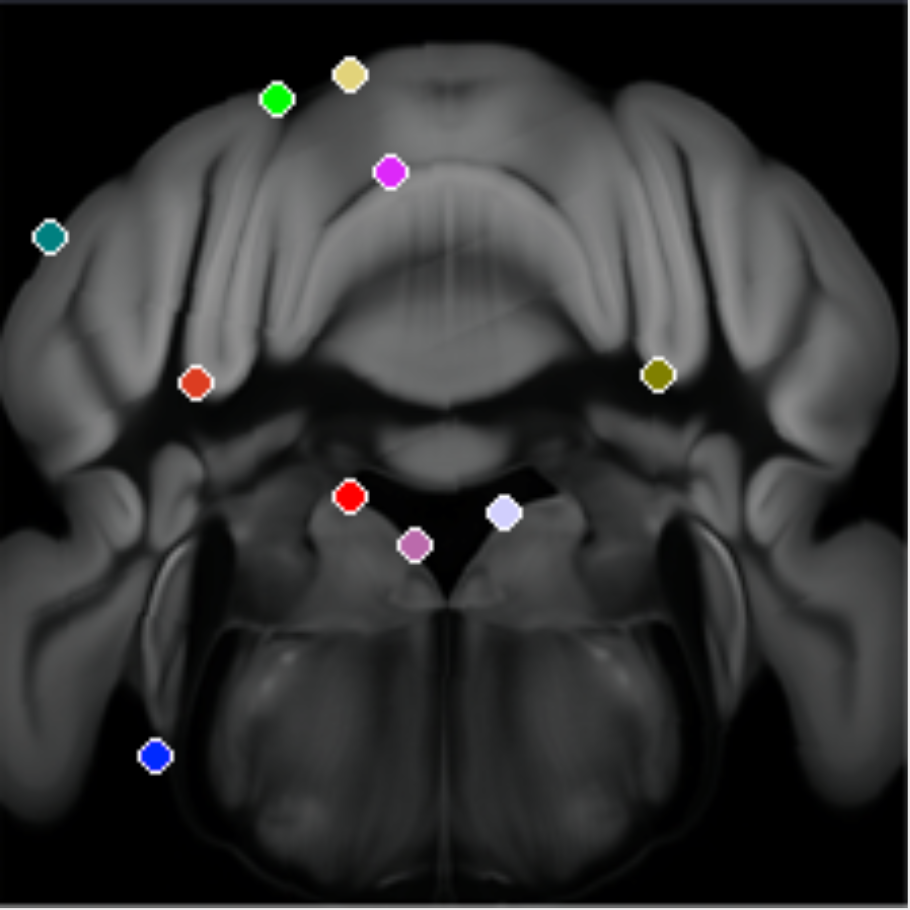 Atlas brain reference
The next challenge was transforming/morphing the Mouse Brain to the Atlas space. At first I tried Homography — a method that adjusts a 2D plane in 3D space to create squeezing, rotation, and other various linear transforms. This was decent but not meeting our expectation for a quality image overlay. Below is an overview of what Homography is trying to accomplish.
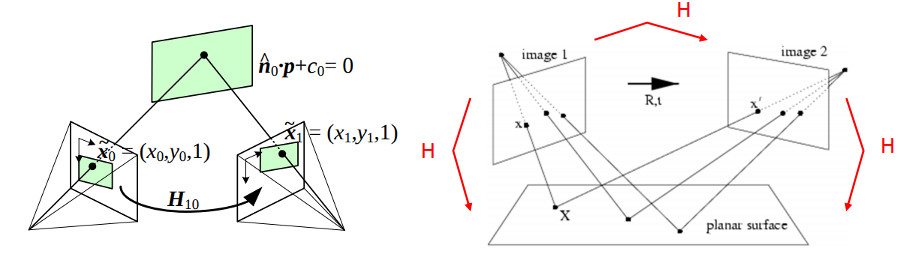 Homography overview
Working through the math we were certain we needed a non-linear method for image morphing. I came across a method of using a triangular mesh that would transform over triangles from one mesh to another, linearly reconstructing the mesh in a different space. Below is the triangle mesh placed over the Mouse Brain.
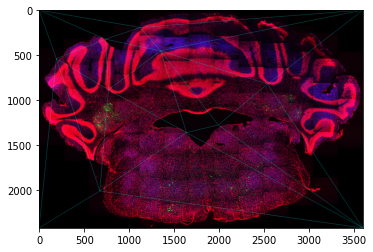 Triangular mesh over mouse brain
We already had the Homography figured out so transforming the triangles to the other mesh was straightforward. You can see the final output of the full registration below — bottom left is the original mouse brain, moving through the flow from transform to overlay.
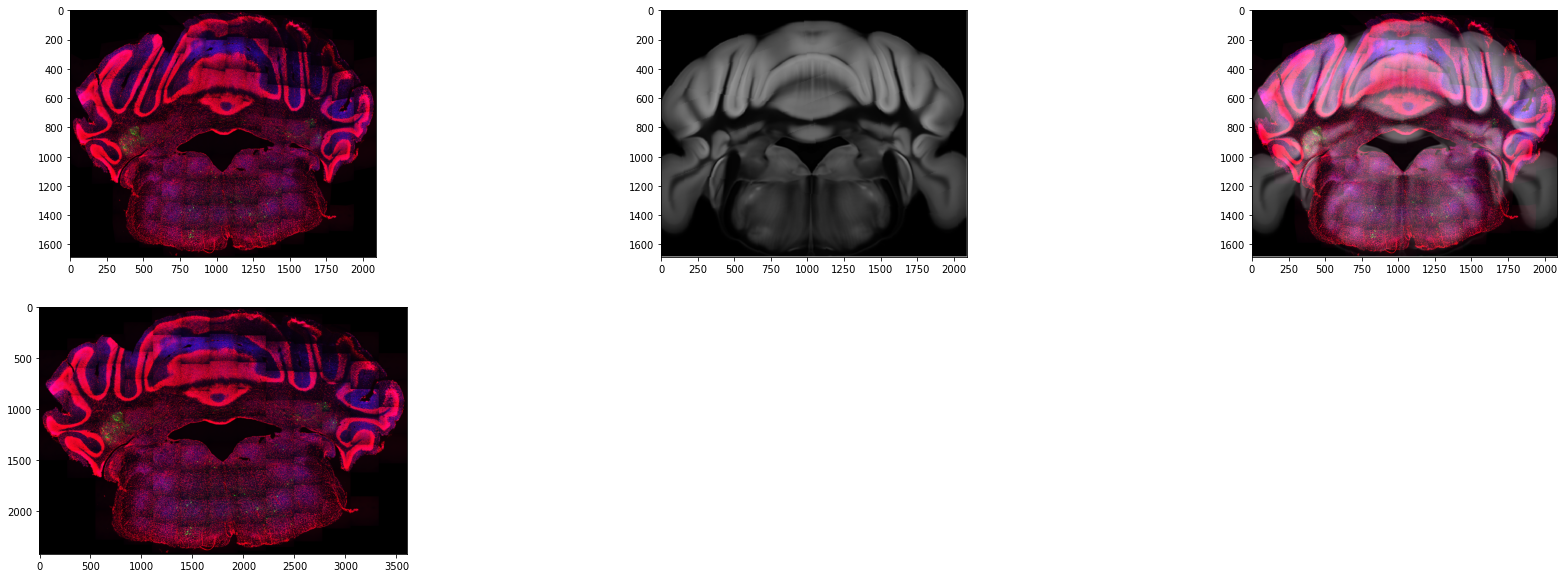 Full registration transform result
Cell Count
The next challenge we faced was counting cells in the images. We used fluorescent markers on some experiments to mark the cell bodies, and on other experiments the cell membrane was marked using a different technique. The method of marking the cell bodies was easy to identify as they were just blobs in the image. We used algorithms like Connected Components and Watershed to count the cells accurately with marginal error.
Useful tutorial on cell counting with Watershed + OpenCV